
What Is Product Adoption? Stages, Metrics, and How to Improve It


Product adoption happens when the user starts using it habitually because it delivers value and helps them accomplish their goals.
To adopt the product, the user first needs to recognize its value and experience it firsthand (activation), and use the product regularly to become competent.
You can help them adopt the product with personalized onboarding, product education, support, and in-app messaging that keeps them engaged and helps them discover new features.
Product adoption rate is the key metric we use to measure adoption. Others include user activation, time to value, feature adoption, user retention, and product stickiness.
In this article, I’ll break down the six product adoption stages, how markets adopt products, how to measure adoption, and how to diagnose and fix low adoption. I will also explain how AI is affecting product adoption.
What Is Product Adoption?
Product adoption, also called user adoption, is the process during which the user discovers the product value, learns how to use it effectively, and starts using it regularly to achieve their goal.
Depending on the product complexity and use cases, product adoption can happen instantly or take months.
My Calendly adoption was immediate: I signed up, set up my account, customized my booking page and availability, and have been using it to manage my appointments for years.
Adopting Claude, on the other hand, was a lengthy process. I first signed up in 2024 but used it only occasionally, and it didn’t become an integral part of my workflows until last year — when the value finally justified the required effort.
Product adoption vs. acquisition, activation, and engagement
Product adoption, acquisition, activation, and engagement describe different aspects of the customer journey:
- Acquisition happens when a new user signs up for the product or buys a subscription.
- Activation occurs when they complete the first task that drives value. For example, when they record their first Loom video, send it to their colleague, and realize how much time it saved them.
- Engagement describes how much they use the product. For instance, how often they log in or how many tasks they complete.
- Adoption takes place when the user returns repeatedly because of its value. For instance, they use Loom videos daily to communicate with colleagues and clients.
A user can be acquired, activated, and even engaged without being adopted. Someone who logs in daily but never completes the core tasks appears as an active user, but in practice, they’re an unadopted one.
Why Product Adoption Matters
Product adoption directly affects retention, expansion, referrals, and consequently, revenue — particularly in subscription-based products or services (and consumables).
Users who adopt your product renew their subscriptions, upgrade to higher plans, buy add-ons to access additional features, and refer their friends and colleagues.
Users who never adopt churn. They switch to a competitor. Or, when the product solves no particular problem, simply stop using it.
The Six Stages of Product Adoption
Product adoption is a process rather than a single event. I break it down into six stages.
The product adoption process looks the same whether you’re tracking new product adoption after a launch or working on an established tool.
The Product Adoption Curve: Rogers’ Five Adopter Types
Everett Rogers introduced the concept of the product adoption curve, also called the product adoption lifecycle, to demonstrate how a market adopts a new product in Diffusion of Innovations in 1962.
The model divides product users into 5 categories:
- Innovators (2.5%): The first movers, drawn to new products for the novelty itself. They’ll tolerate glitches, bugs, and missing features for the chance to be first.
- Early adopters (13.5%): They adopt early by choice, as soon as they can see a genuine advantage, without waiting for evidence the product works.
- Early majority (34%): Pragmatists who wait for proof. They adopt once the product is established and people they trust already use it.
- Late majority (34%): Skeptics who adopt when staying out costs more than joining.
- Laggards (16%): The last to adopt. They change only when the old way stops being available or workable.
For a product to be viable, it needs to be adopted by the majority. But not many products manage to win over the early majority, which is why Geoffrey Moore called the gap between early adopters and early majority “the chasm” (Crossing the Chasm, 1991).
Product Adoption Metrics
Here are six metrics product teams use to measure product adoption.
Product adoption rate
Product adoption rate is the share of new signups who become regular, active users of the core product.
To calculate it, divide the newly adopted users over a period of time by signups over the same period.
Product adoption rate = (new active users ÷ signups) × 100
Before you calculate it, define your adoption events. Look for events and usage thresholds that correlate with long-term retention.
Just to give you an idea: for Slack, that’s when the team exchanges 2000 messages. For freelance accounting software, this could be tracking expenses for a month and sending 3 invoices.
Activation rate
Activation rate is the share of new users who hit the activation event.
It’s a proxy metric, closely tied to adoption and retention. Amplitude’s year-long study (September 2023-September 2024) found that “69% of products with strong early activation were also strong three-month retention performers.”
This makes sense: if the customer doesn’t see the product value, they have no reason to keep using the product, so no adoption happens.
To calculate activation rate, divide the number of activated users by the number of new sign-ups.
Activation rate = (activated users ÷ signups) × 100
Just like with adoption, first define the activation event.
Time to value
Time to value is how long a new user takes to experience the value of your product for the first time. The shorter it is, the more likely the user is to activate and adopt the product.
Time to value depends heavily on what your product does. For complex enterprise software, like Salesforce, it could be weeks. For a simpler app, like Loom, minutes because that’s what it takes to record, edit, and share a video.
Feature adoption rate
Feature adoption rate is the same formula as for product adoption but applied to a single feature.
To calculate it, divide regular feature users by all product users.
Feature adoption rate = (active feature users ÷ all product users) × 100
Core feature adoption rate correlates with product adoption rate.
User retention rate
Retention rate is the share of users still active after a set period.
To calculate it, subtract newly acquired users from the number of active users at the end of a period by the number at the beginning.
User retention rate = ((active users at the end – newly acquired users) ÷ all product users) × 100
For adoption, retention is the confirming metric. Users who adopted your product stay; users who never adopted leave.
Stickiness
Stickiness divides daily active users by monthly active users (DAU/MAU) to show how often people return within a month.
A few caveats about stickiness as an adoption metric:
- A login doesn’t mean the user is actually using the core features to get value.
- Not all B2B products, like accounting software, are used daily, so the metric will be skewed even if the product is doing the job perfectly.
- The ratio doesn’t take segments into account, so power users and one-time visitors average into one number.
How AI Is Changing Product Adoption
Easy access to AI tools and their improving capabilities mean teams ship features and products faster, but users adopt them at the same pace as before, which brings adoption rates down. By users, we mean not only humans but also AI agents, so you have to prioritize bot-friendly architecture and integrations.
Faster releases widen the adoption gap
AI-powered product and development teams release features faster than users absorb them, which widens the gap between released and adopted.
On the Mostly Growth podcast in November 2025, Brian Balfour, the Founder of Reforge and former VP of Growth at HubSpot, talked about how his team increased their feature velocity and launched five major products in a single year thanks to AI.
However, this doesn’t mean new products get adopted equally fast.
“Our product velocity is outpacing our product adoption. And I’m seeing this in a bunch of other companies as well,” he said.
His explanation?
“You can accelerate things towards the speed of computers with AI, but the ultimate bottleneck is us.” Users have to build new habits and rethink how a product fits their work, and that happens at human speed.
Another issue that Brian flags: less focus on discovery. If you can build features faster and cheaper, less effort goes into validating if you should build them in the first place (classic feature factory mode). And building features nobody needs means lower adoption.
AI agents are becoming a second user class
AI agents that call products directly through the Model Context Protocol (MCP) are becoming a legit user class.
According to IDC, MCP downloads went up from roughly 100,000 in November 2024, when it was first launched by Anthropic, to 22 million monthly downloads in March 2025, when OpenAI adopted the standard.
This has implications for how you design your product, according to IDC’s Eric Newmark: “AI agents don’t care about your UI… What they need is data access, API depth, and integration reliability. That’s a fundamental shift in what enterprise software is actually for.”
Kyle Poyar (March 2026) argues that certain adoption metrics won’t matter as much for the same reason: “If AI is taking on digital labor, or if our products are used inside other products (ex: via Model Context Protocol or MCP)… Do we still need to obsess over DAUs, MAUs, or DAU/MAU?”
How to Improve Product Adoption
To achieve higher adoption rates, build personalized onboarding flows, announce features and drive engagement with in-app messages, build customer education programs, and offer self-serve support.
Build personalized onboarding around the first value moment
Build primary onboarding flows that lead new users to activation as quickly as possible.
For example, trigger a checklist that takes them through the setup process and pair it up with interactive walkthroughs that show how to complete the tasks and showcase the key features they need to achieve their goals.
Introduce more advanced features only when the user adopts the core ones (secondary onboarding).
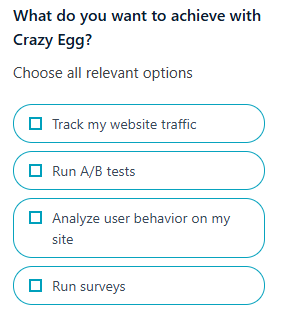
If your SaaS product caters to multiple user personas, start onboarding with a survey about users’ objectives and use the answers to personalize the onboarding flows.
Announce new features and drive engagement with contextual in-app messages
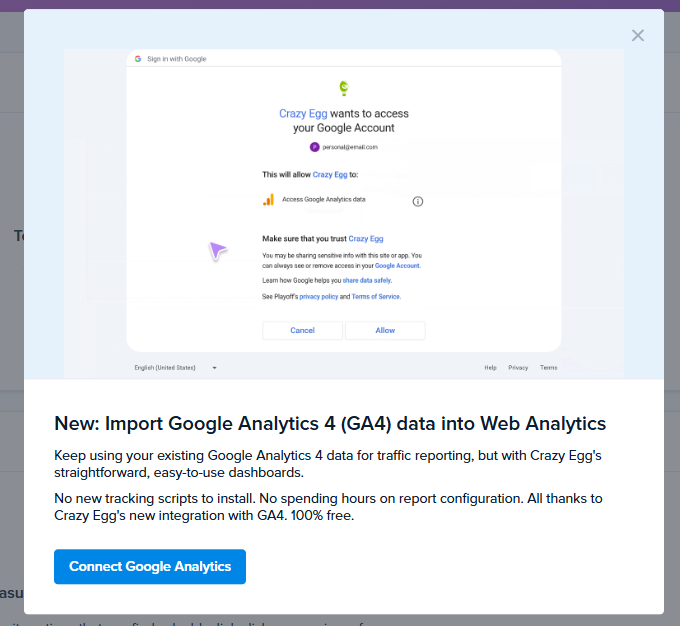
When you release new features, announce them inside the app and prompt users to engage with them until they activate and adopt them.
This normally requires multiple messages. For example, an announcement pop-up or banner when the feature goes live and tooltips that appear next to the feature whenever the user is on the relevant screen.
Just like the onboarding flows, the in-app messages should be personalized. Don’t pester users with messages about features they will never need.
Better yet, trigger them contextually, so they appear when the user needs the feature. For example, announce a scheduling feature in your social media management tool when they want to share a post.
Invest in customer education
Customer education builds upon the onboarding. It helps them realize the full product value and keeps them engaged.
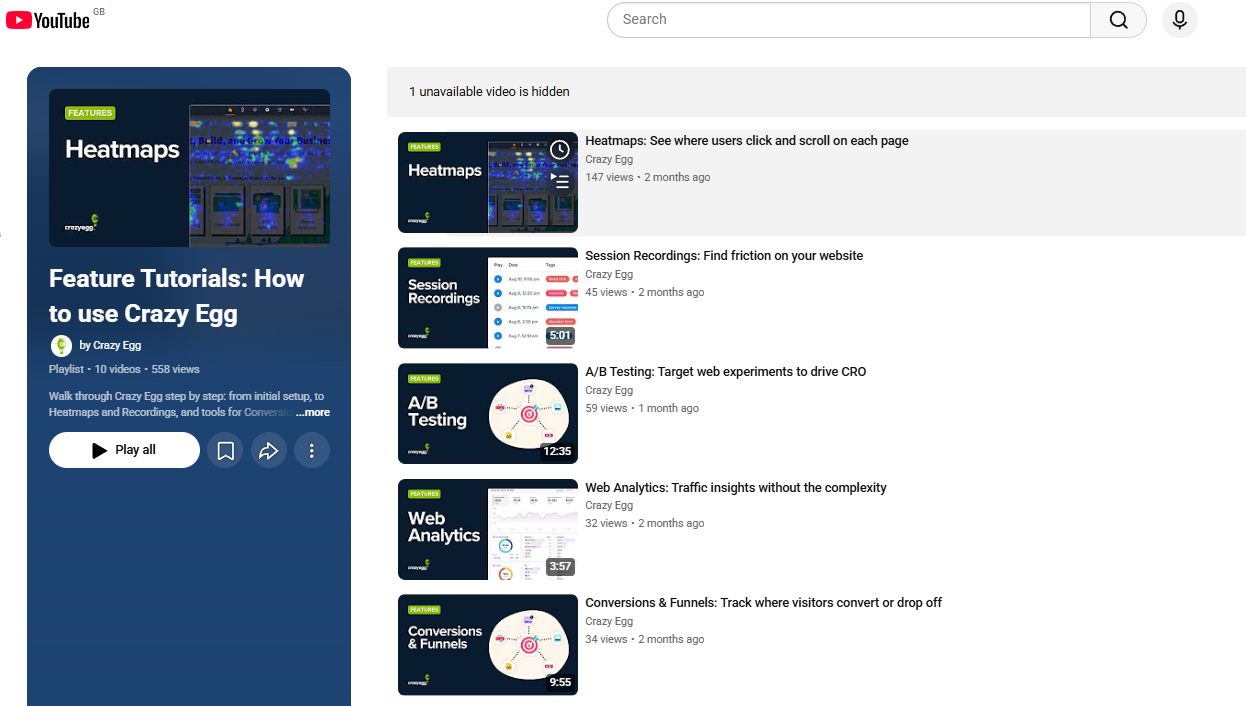
Start building your customer education program with a library of tutorials, use-case guides, and templates. Expand with a webinar series and a certification course, both of which help you attract new customers.
Offer reliable self-serve support
When a user hits a problem mid-task, they want it solved immediately, and delays increase the drop-off risk.
The catch is that contacting customer support isn’t always practical, and users prefer to solve their problems on their own anyway.
The solution is an in-app resource center with a searchable knowledge base, where they can easily find relevant resources, and a bot chat that will point them in the right direction and route more serious issues to support agents when they’re available.
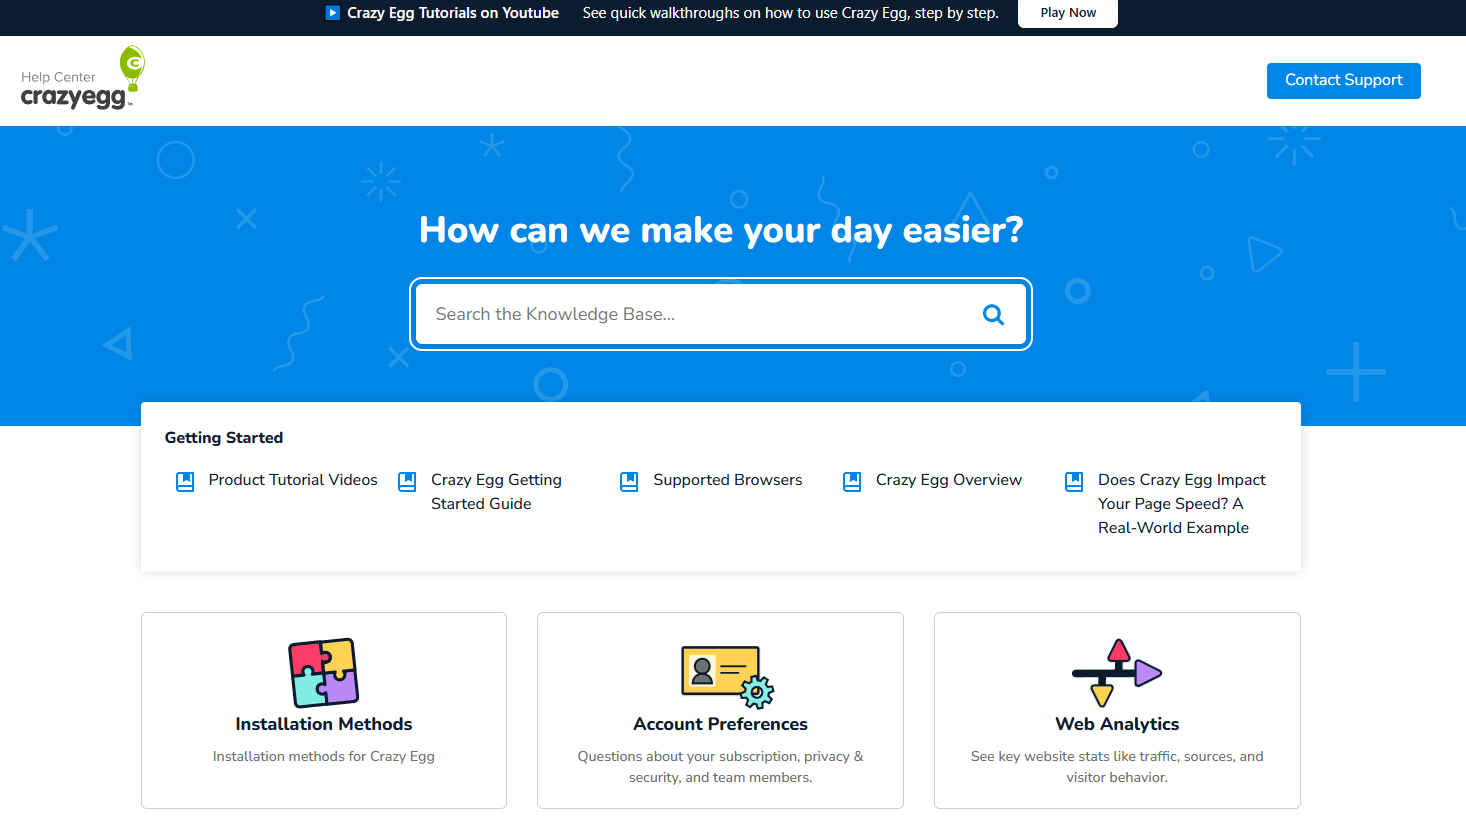
Your support content is also a diagnostic instrument. The resource center searches and the content users access point to friction points.
How to Diagnose Low Product Adoption Causes
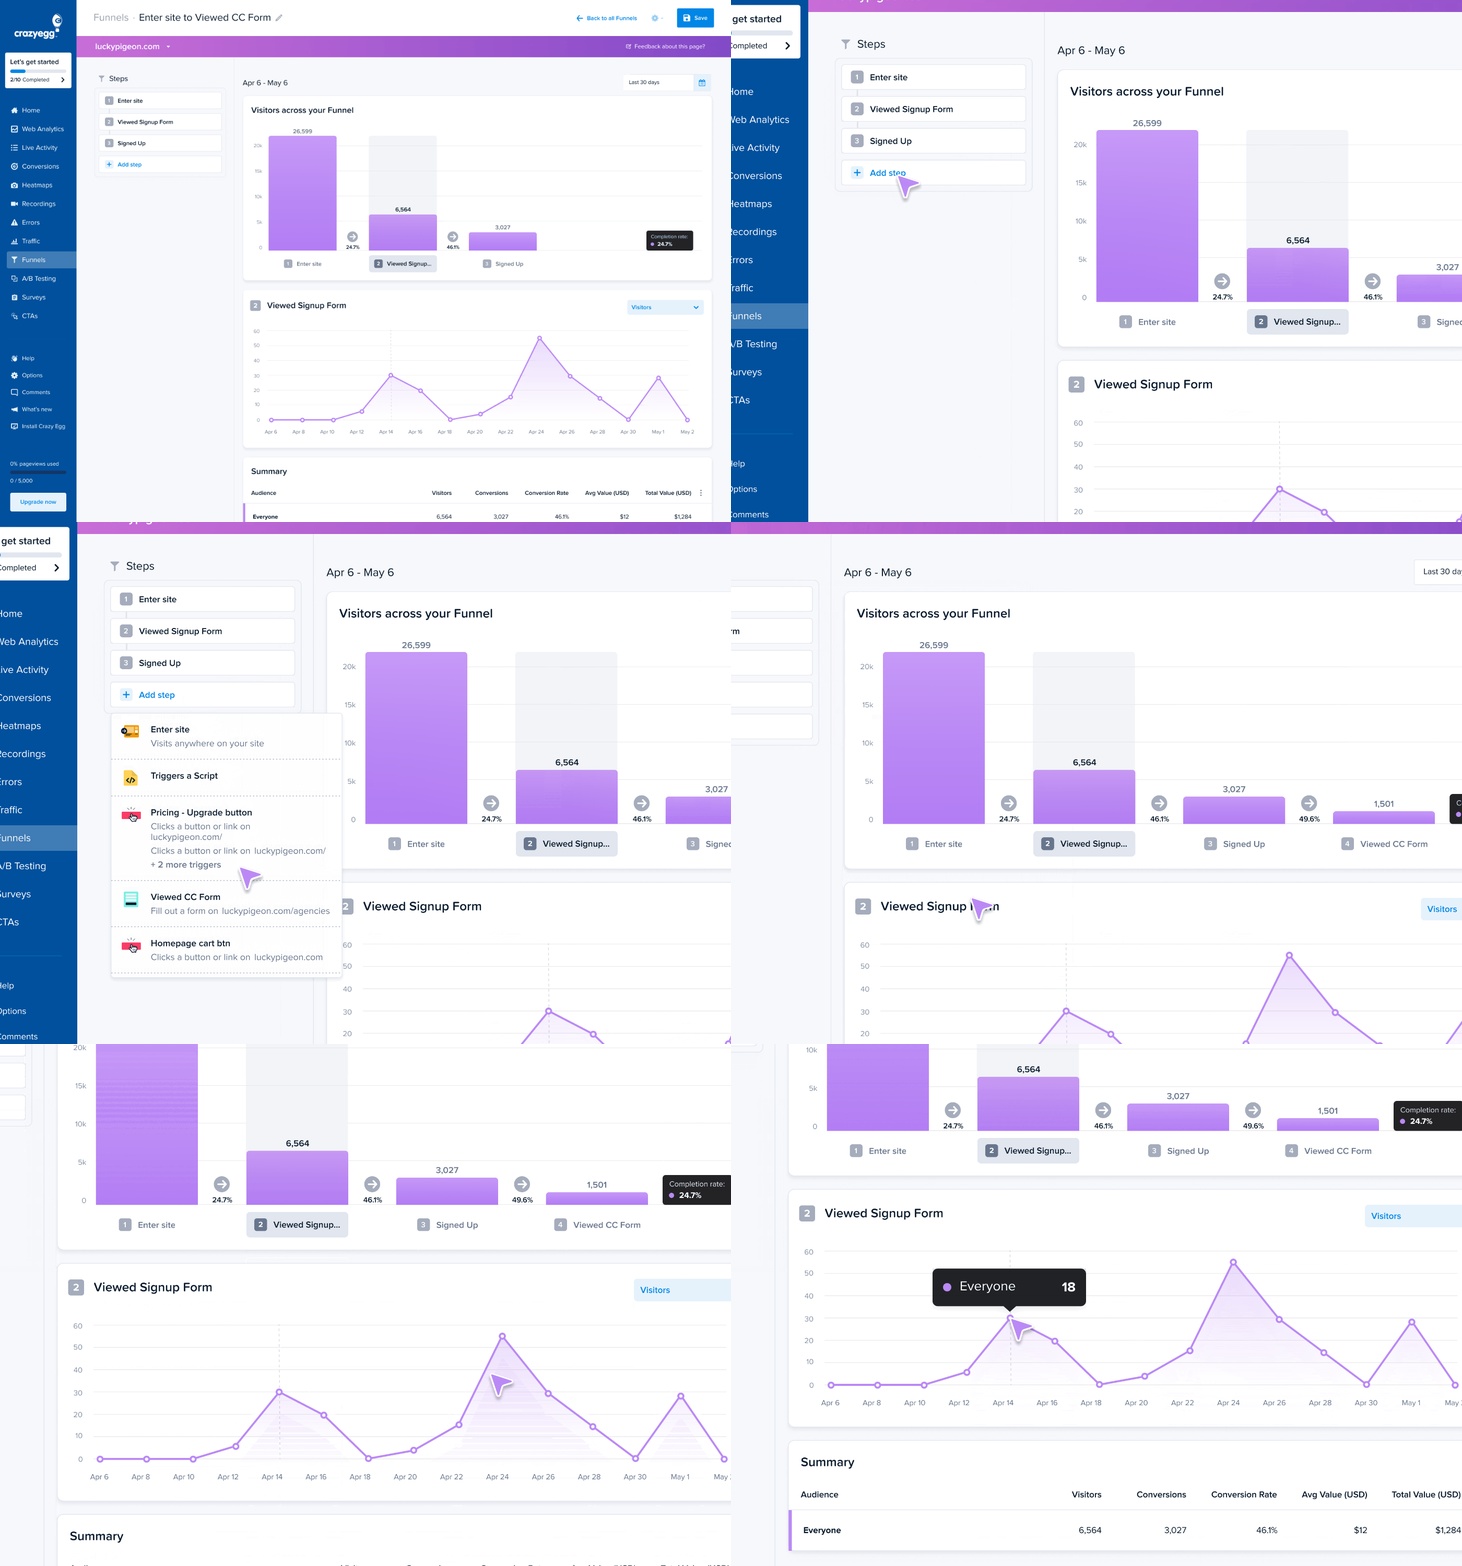
To find out how to improve the adoption rate, use funnel analysis to determine where drop-off occurs, then analyze their behavior within the product with session recordings, and collect customer feedback via surveys.
Map the funnel to find where users drop off
Start by mapping out all stages and touchpoints in the customer journey, from signup to the adoption event, and use funnel analysis to find the stage where the bucket is leaking the most. Start optimizing from there.
For instance, if your signups fail to reach activation, you might need to focus on new user onboarding. If they activate but fail to adopt the key features, focus on driving engagement with in-app messages and emails.
Watch session recordings to see where users struggle
To determine the actual cause of low conversion rates at different funnel stages, watch session recordings of the users who drop off there and look for patterns.
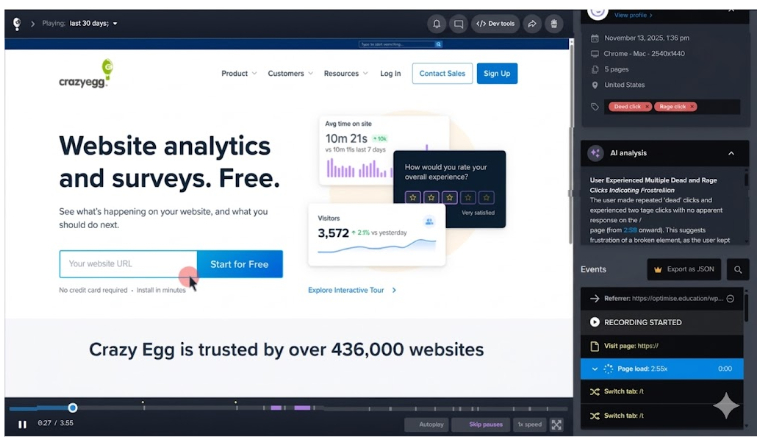
For example, users scrolling past key features they need, not being able to find them in the menu, rage-clicking on the unclickable UI elements.
These friction elements increase the time to value and negatively impact the user experience, both of which reduce the adoption rates.
Collect user feedback with in-app and email surveys
Surveys help you understand how users feel about the product and how to better satisfy their needs.
Use contextual in-app surveys to get feedback on the user experience. For example, trigger one when someone completes an action or is about to exit the app.
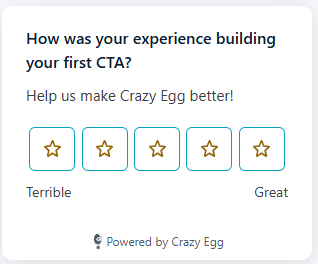
Email surveys tend to have lower response rates than in-app surveys, but they’re the only way to reach inactive users. Use them to collect feedback on why the user churned.
Enrich the survey responses with insights from customer support tickets, reviews, and sales or customer success calls to get a complete picture of how to reduce the time to value and drive repeated product use.
Once you identify issues and fix them, close the feedback loop and share the news with the users. To demonstrate you value their feedback and act on it.
Start With Where Users Drop Off
Before you implement any changes to your onboarding flows, in-app messaging, customer education, or support, diagnose the causes: find the drop-off, watch why it happens, and collect feedback.
If you want to run the loop on your own site, Crazy Egg covers it end to end: funnels to find drop-off points, session recordings to see where users struggle, surveys to capture feedback, and popup CTAs to communicate with users and drive engagement.
Try it for free for 30 days. No credit card required.
